
DVSA data, cars, 2025
MOT fail rates by area 2025
Highest car MOT fail rate in Britain
Fife (KY postcodes). The lowest is Ilford, at 20.0%. Across Great Britain 27.7% of cars failed first time, from 33.2 million car MOTs in 2025.
Key findings
- Kirkcaldy (Fife) has the highest fail rate: 36.2% of cars failed first time, against 27.7% nationally, even though its cars are younger than average (9.8 years at test, against 10.7). Its most common failure was "broken coil spring", recorded 10,703 times.
- The 12 highest fail rates: Kirkcaldy (Fife), Plymouth, Exeter, Dundee, Truro, Torquay, Llandrindod Wells, Bristol, Salisbury, Bath, Dorchester and Brighton.
- Ilford has the lowest: 20.0%. 9 of the 10 lowest are London postcode areas.
- 7.3% of car MOTs found at least one dangerous defect (2,419,495 cars). The highest share was in Blackpool: 10.4%, about 1 in 10. Driving a car with a dangerous defect can mean a fine of up to £2,500 and 3 penalty points.
- "Broken coil spring" is the most common single failure in 38 of the 118 areas.
The map
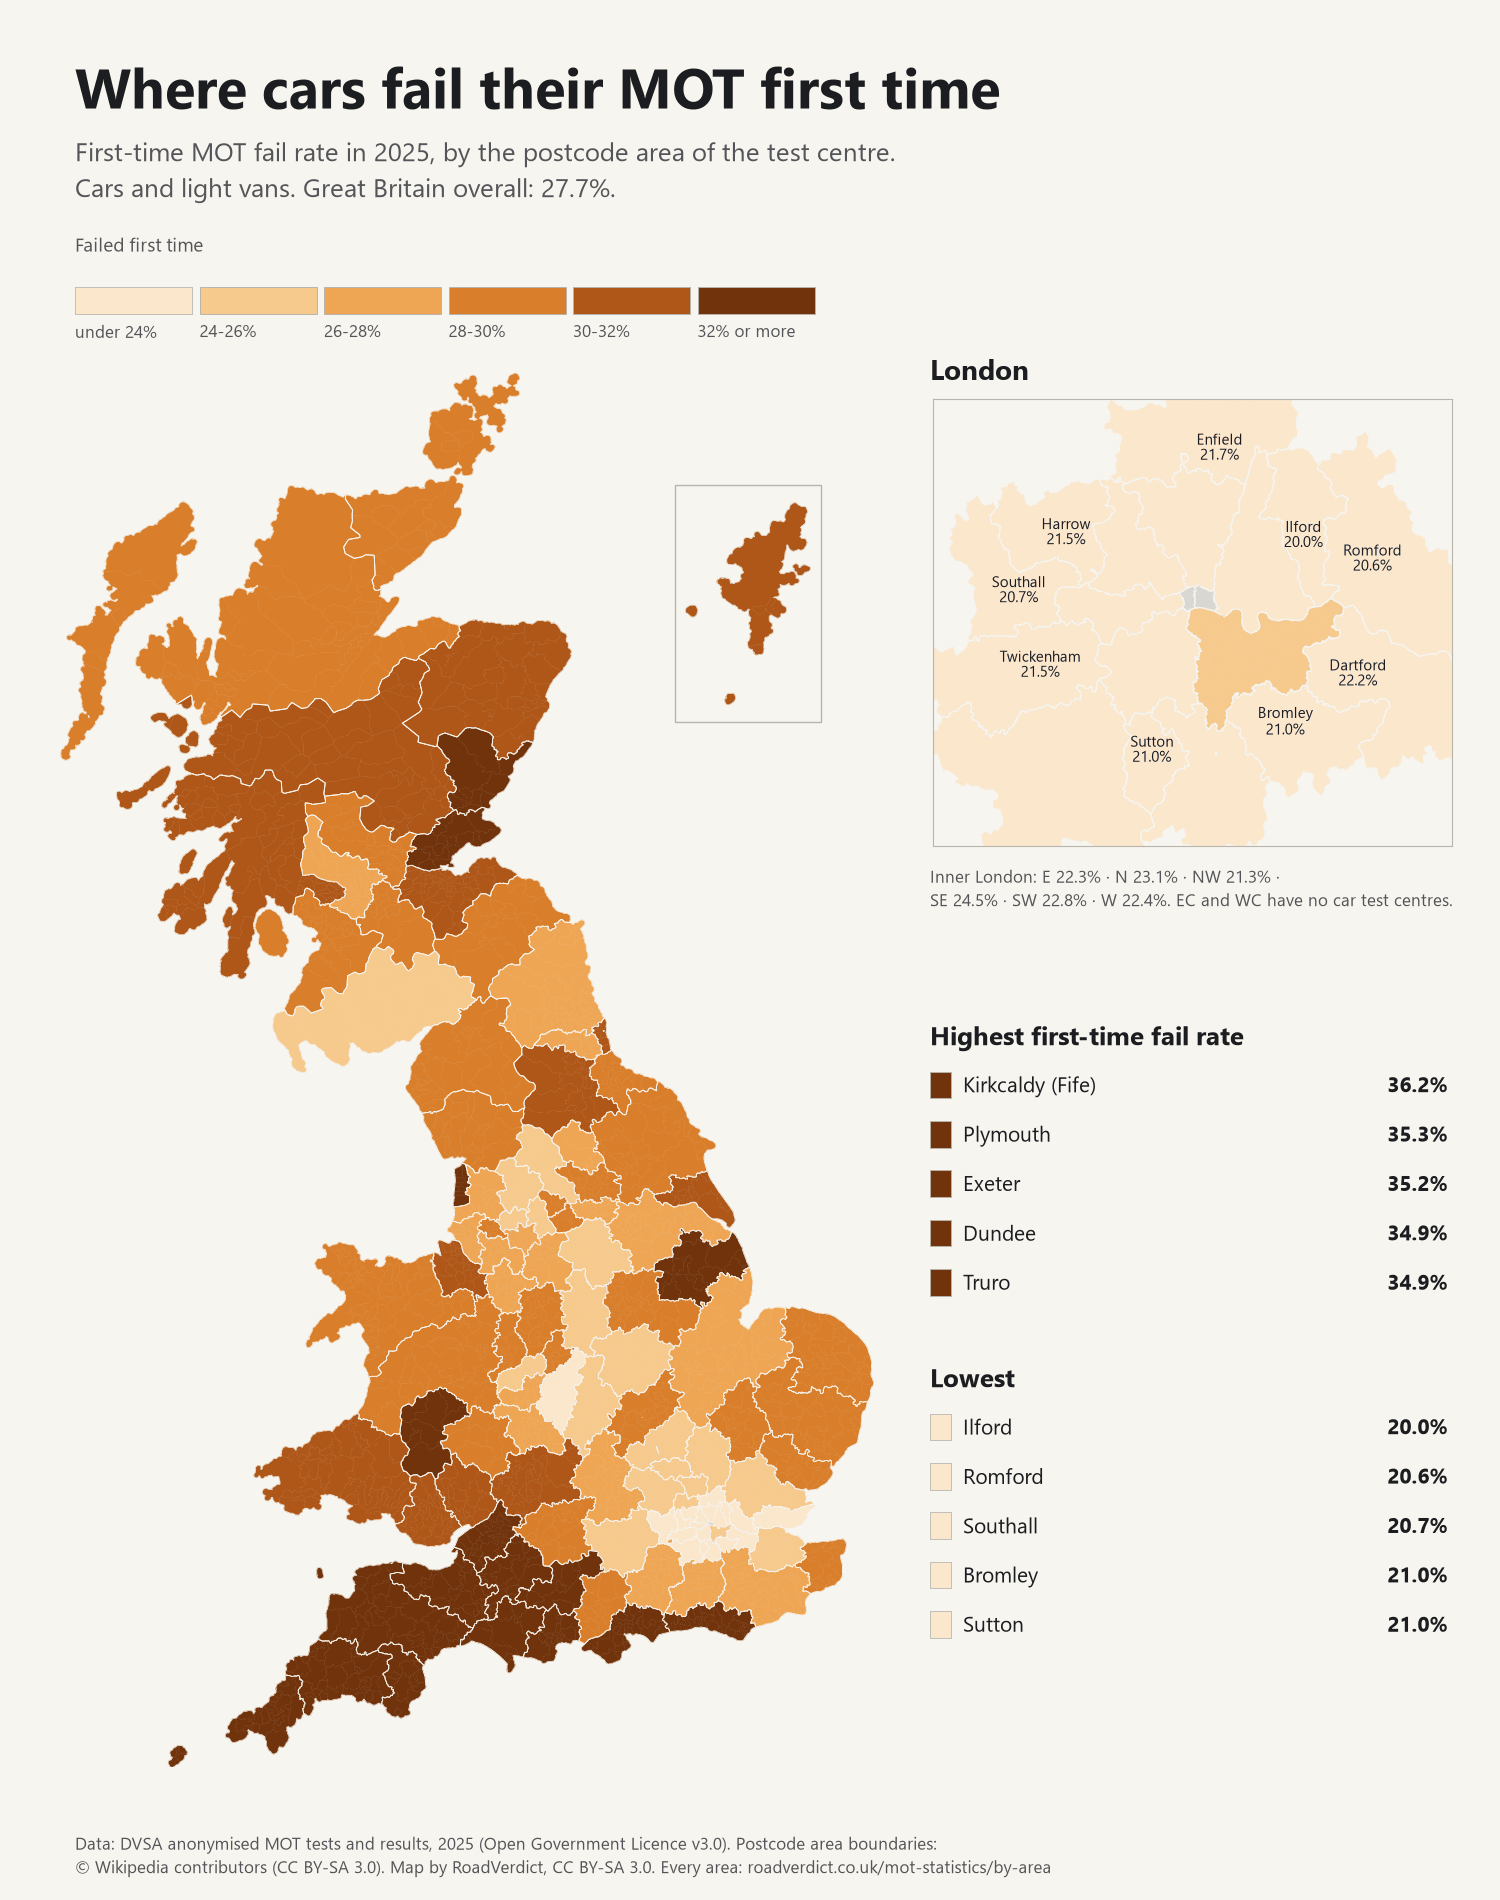
Every postcode area, highest fail rate first
Cars and light vans, first MOT tests in 2025. "Dangerous" is the share of tests that found at least one dangerous defect. Age is the car's average age at the test.
On a phone the table shows the main figures. Find your area above for all of them.
| Rank | Postcode area | Car MOTs | Failed first time | Dangerous defect | Average age | Most common failure |
|---|---|---|---|---|---|---|
| 1 | Fife (KY) | 186,858 | 36.2% | 9.4% | 9.8 years | Broken coil spring (10,703) |
| 2 | Plymouth (PL) | 339,450 | 35.3% | 10.2% | 11.9 years | Tyre tread below 1.6mm (18,119) |
| 3 | Exeter (EX) | 374,484 | 35.2% | 8.9% | 12 years | Tyre tread below 1.6mm (16,721) |
| 4 | Dundee (DD) | 136,160 | 34.9% | 9.6% | 9.4 years | Broken coil spring (8,428) |
| 5 | Truro (TR) | 203,285 | 34.9% | 9.9% | 12.1 years | Tyre tread below 1.6mm (9,875) |
| 6 | Torquay (TQ) | 169,280 | 34.5% | 9.3% | 12.5 years | Tyre tread below 1.6mm (7,337) |
| 7 | Llandrindod Wells (LD) | 28,368 | 34.4% | 8.9% | 11.6 years | Broken coil spring (1,376) |
| 8 | Bristol (BS) | 575,556 | 34.0% | 8.7% | 11.1 years | Sidelight not working (21,017) |
| 9 | Salisbury (SP) | 159,006 | 33.8% | 8.7% | 11.6 years | Tyre cut down to the cords (5,913) |
| 10 | Bath (BA) | 281,123 | 33.3% | 8.8% | 11.7 years | Sidelight not working (10,495) |
| 11 | Dorchester (DT) | 130,375 | 33.2% | 8.5% | 12.7 years | Sidelight not working (5,370) |
| 12 | Brighton (BN) | 402,221 | 32.8% | 8.5% | 11.6 years | Sidelight not working (14,868) |
| 13 | Taunton (TA) | 217,052 | 32.7% | 8.0% | 12.2 years | Sidelight not working (8,016) |
| 14 | Portsmouth (PO) | 470,978 | 32.6% | 8.4% | 11.7 years | Tyre cut down to the cords (18,119) |
| 15 | Lincoln (LN) | 188,510 | 32.2% | 7.7% | 10.7 years | Broken coil spring (7,998) |
| 16 | Blackpool (FY) | 141,300 | 32.2% | 10.4% | 10.9 years | Tyre tread below 1.6mm (6,303) |
| 17 | Bournemouth (BH) | 348,759 | 32.0% | 7.7% | 11.8 years | Sidelight not working (11,933) |
| 18 | Aberdeen (AB) | 254,259 | 32.0% | 7.8% | 9.2 years | Broken coil spring (14,017) |
| 19 | Swansea (SA) | 420,248 | 31.3% | 9.2% | 10.7 years | Tyre tread below 1.6mm (21,897) |
| 20 | Cardiff (CF) | 539,764 | 31.3% | 10.0% | 10.4 years | Tyre tread below 1.6mm (30,378) |
| 21 | Hull (HU) | 231,618 | 31.1% | 8.2% | 10.3 years | Broken coil spring (9,211) |
| 22 | Newport (NP) | 290,375 | 31.0% | 8.9% | 10.8 years | Tyre tread below 1.6mm (13,417) |
| 23 | Shetland (ZE) | 12,372 | 30.8% | 8.7% | 9.1 years | Tyre tread below 1.6mm (882) |
| 24 | Gloucester (GL) | 410,599 | 30.7% | 8.3% | 11.6 years | Tyre tread below 1.6mm (14,098) |
| 25 | Paisley (PA) | 152,360 | 30.7% | 8.5% | 9.1 years | Broken coil spring (8,474) |
| 26 | Perth (PH) | 98,541 | 30.5% | 7.7% | 9.4 years | Broken coil spring (5,253) |
| 27 | Sunderland (SR) | 110,609 | 30.5% | 9.4% | 9.8 years | Broken coil spring (5,409) |
| 28 | Chester (CH) | 369,877 | 30.3% | 8.0% | 10.5 years | Broken coil spring (13,039) |
| 29 | Darlington (DL) | 192,426 | 30.1% | 7.7% | 10.2 years | Broken coil spring (10,188) |
| 30 | Edinburgh (EH) | 418,764 | 30.0% | 8.0% | 9.3 years | Broken coil spring (18,895) |
| 31 | Llandudno (LL) | 317,464 | 29.9% | 8.2% | 11.5 years | Broken coil spring (14,090) |
| 32 | Falkirk (FK) | 143,757 | 29.7% | 7.3% | 8.9 years | Broken coil spring (6,859) |
| 33 | Wigan (WN) | 154,435 | 29.6% | 8.5% | 10.3 years | Tyre tread below 1.6mm (5,599) |
| 34 | York (YO) | 315,823 | 29.5% | 7.3% | 10.5 years | Broken coil spring (13,722) |
| 35 | Norwich (NR) | 456,465 | 29.4% | 6.7% | 11.6 years | Tyre cut down to the cords (17,058) |
| 36 | Halifax (HX) | 83,052 | 29.3% | 7.8% | 10.6 years | Broken coil spring (3,935) |
| 37 | Northampton (NN) | 451,762 | 29.3% | 7.3% | 10.6 years | Sidelight not working (12,601) |
| 38 | Motherwell (ML) | 164,970 | 29.2% | 9.2% | 8.7 years | Broken coil spring (8,979) |
| 39 | Kilmarnock (KA) | 178,076 | 29.2% | 8.2% | 9.2 years | Broken coil spring (10,187) |
| 40 | Lancaster (LA) | 180,363 | 29.2% | 8.6% | 10.9 years | Tyre tread below 1.6mm (7,294) |
| 41 | Huddersfield (HD) | 136,726 | 29.2% | 8.0% | 10 years | Broken coil spring (4,551) |
| 42 | Swindon (SN) | 296,008 | 29.1% | 7.4% | 11.1 years | Sidelight not working (9,392) |
| 43 | Canterbury (CT) | 256,716 | 29.0% | 7.2% | 11.5 years | Sidelight not working (8,355) |
| 44 | Inverness (IV) | 143,021 | 29.0% | 6.3% | 9.6 years | Broken coil spring (7,257) |
| 45 | Ipswich (IP) | 395,533 | 29.0% | 6.7% | 11.5 years | Tyre cut down to the cords (15,337) |
| 46 | Galashiels (TD) | 63,587 | 28.9% | 7.6% | 9.9 years | Broken coil spring (3,541) |
| 47 | Southampton (SO) | 406,858 | 28.9% | 7.1% | 11.2 years | Sidelight not working (12,979) |
| 48 | Nottingham (NG) | 615,138 | 28.8% | 7.3% | 10.8 years | Broken coil spring (20,959) |
| 49 | Kirkwall (KW) | 27,960 | 28.8% | 7.5% | 10.5 years | Broken coil spring (1,457) |
| 50 | Outer Hebrides (HS) | 14,822 | 28.7% | 8.0% | 10.2 years | Broken coil spring (802) |
| 51 | Stoke-on-Trent (ST) | 369,773 | 28.6% | 7.7% | 10.5 years | Broken coil spring (12,782) |
| 52 | Colchester (CO) | 263,636 | 28.6% | 7.6% | 11.5 years | Sidelight not working (8,909) |
| 53 | Shrewsbury (SY) | 225,180 | 28.4% | 7.1% | 11.3 years | Broken coil spring (7,969) |
| 54 | Cleveland (TS) | 308,138 | 28.4% | 7.3% | 10.2 years | Broken coil spring (14,499) |
| 55 | Cambridge (CB) | 235,701 | 28.3% | 6.7% | 11.2 years | Tyre cut down to the cords (9,181) |
| 56 | Walsall (WS) | 238,980 | 28.3% | 7.6% | 10.7 years | Tyre tread below 1.6mm (7,134) |
| 57 | Telford (TF) | 126,240 | 28.2% | 7.2% | 11.1 years | Broken coil spring (4,192) |
| 58 | Carlisle (CA) | 198,012 | 28.1% | 7.3% | 10.1 years | Tyre tread below 1.6mm (6,692) |
| 59 | Hereford (HR) | 124,379 | 28.1% | 7.1% | 11.7 years | Broken coil spring (4,073) |
| 60 | Leeds (LS) | 373,060 | 28.1% | 8.2% | 10.2 years | Tyre tread below 1.6mm (13,284) |
| 61 | Doncaster (DN) | 433,685 | 28.0% | 7.0% | 10.6 years | Broken coil spring (15,216) |
| 62 | Oxford (OX) | 372,106 | 28.0% | 7.1% | 11.2 years | Sidelight not working (11,539) |
| 63 | Tonbridge (TN) | 444,864 | 27.9% | 7.3% | 11.5 years | Sidelight not working (13,843) |
| 64 | Glasgow (G) | 532,334 | 27.8% | 8.4% | 8.9 years | Broken coil spring (24,159) |
| 65 | Guildford (GU) | 453,061 | 27.7% | 6.6% | 11 years | Tyre cut down to the cords (14,577) |
| 66 | Crewe (CW) | 201,508 | 27.4% | 7.9% | 10.2 years | Tyre tread below 1.6mm (6,617) |
| 67 | Preston (PR) | 305,315 | 27.3% | 8.0% | 10.4 years | Tyre tread below 1.6mm (12,183) |
| 68 | Manchester (M) | 498,544 | 27.1% | 8.3% | 10.9 years | Tyre tread below 1.6mm (17,332) |
| 69 | Stockport (SK) | 335,296 | 27.1% | 7.5% | 10 years | Tyre tread below 1.6mm (9,879) |
| 70 | Worcester (WR) | 196,043 | 27.1% | 7.1% | 11.2 years | Tyre tread below 1.6mm (5,935) |
| 71 | Peterborough (PE) | 617,736 | 27.0% | 6.6% | 11 years | Broken coil spring (17,338) |
| 72 | Newcastle upon Tyne (NE) | 556,809 | 26.8% | 6.9% | 9.9 years | Broken coil spring (23,054) |
| 73 | Warrington (WA) | 340,554 | 26.7% | 7.6% | 9.8 years | Tyre tread below 1.6mm (11,040) |
| 74 | Durham (DH) | 165,412 | 26.3% | 7.1% | 10 years | Broken coil spring (7,778) |
| 75 | Wakefield (WF) | 294,951 | 26.3% | 8.3% | 10.4 years | Tyre tread below 1.6mm (11,577) |
| 76 | Dudley (DY) | 225,523 | 26.1% | 6.1% | 11.1 years | Sidelight not working (6,181) |
| 77 | Harrogate (HG) | 93,409 | 26.1% | 6.8% | 9.7 years | Broken coil spring (3,672) |
| 78 | Liverpool (L) | 363,255 | 26.1% | 7.4% | 10.2 years | Tyre tread below 1.6mm (11,138) |
| 79 | Redhill (RH) | 346,774 | 26.0% | 6.9% | 11.3 years | Sidelight not working (9,763) |
| 80 | Watford (WD) | 131,737 | 26.0% | 6.8% | 9.8 years | Tyre cut down to the cords (4,086) |
| 81 | Bradford (BD) | 295,508 | 25.9% | 7.8% | 11 years | Tyre tread below 1.6mm (11,606) |
| 82 | Stevenage (SG) | 243,292 | 25.8% | 6.2% | 10.7 years | Sidelight not working (6,518) |
| 83 | Wolverhampton (WV) | 224,430 | 25.8% | 7.0% | 10.6 years | Tyre tread below 1.6mm (6,559) |
| 84 | Leicester (LE) | 589,085 | 25.8% | 6.9% | 11 years | Sidelight not working (15,890) |
| 85 | Oldham (OL) | 228,145 | 25.7% | 7.7% | 10.2 years | Tyre tread below 1.6mm (7,994) |
| 86 | Milton Keynes (MK) | 349,988 | 25.7% | 6.8% | 10.6 years | Tyre tread below 1.6mm (10,222) |
| 87 | Medway (ME) | 355,180 | 25.7% | 6.0% | 11 years | Sidelight not working (10,358) |
| 88 | Dumfries (DG) | 77,778 | 25.6% | 6.8% | 10.4 years | Broken coil spring (3,481) |
| 89 | Reading (RG) | 506,805 | 25.2% | 6.1% | 10.8 years | Tyre cut down to the cords (14,958) |
| 90 | Derby (DE) | 458,772 | 25.1% | 6.3% | 10.6 years | Broken coil spring (11,963) |
| 91 | Luton (LU) | 219,158 | 25.1% | 6.5% | 11.2 years | Tyre tread below 1.6mm (6,354) |
| 92 | Coventry (CV) | 491,027 | 25.0% | 6.4% | 10.8 years | Sidelight not working (12,593) |
| 93 | Bolton (BL) | 254,329 | 25.0% | 7.3% | 9.9 years | Tyre tread below 1.6mm (8,796) |
| 94 | Sheffield (S) | 749,011 | 24.7% | 6.7% | 10.7 years | Broken coil spring (22,083) |
| 95 | Hemel Hempstead (HP) | 321,232 | 24.7% | 6.4% | 10.9 years | Tyre tread below 1.6mm (7,971) |
| 96 | South East London (SE) | 260,886 | 24.5% | 5.3% | 10.9 years | Sidelight not working (7,996) |
| 97 | Blackburn (BB) | 288,452 | 24.4% | 7.0% | 10.6 years | Tyre tread below 1.6mm (10,385) |
| 98 | Chelmsford (CM) | 399,806 | 24.3% | 6.1% | 10.4 years | Tyre cut down to the cords (9,986) |
| 99 | St Albans (AL) | 147,254 | 24.0% | 5.7% | 10.2 years | Sidelight not working (3,376) |
| 100 | Birmingham (B) | 1,038,789 | 24.0% | 6.1% | 10.9 years | Tyre tread below 1.6mm (26,818) |
| 101 | Southend-on-Sea (SS) | 291,456 | 23.2% | 6.1% | 11.1 years | Sidelight not working (7,661) |
| 102 | North London (N) | 224,138 | 23.1% | 5.8% | 10.9 years | Sidelight not working (6,468) |
| 103 | South West London (SW) | 143,591 | 22.8% | 5.5% | 10.3 years | Wipers not clearing the screen (3,633) |
| 104 | West London (W) | 89,463 | 22.4% | 5.5% | 10.1 years | Wipers not clearing the screen (2,151) |
| 105 | East London (E) | 268,239 | 22.3% | 5.4% | 10.3 years | Sidelight not working (7,797) |
| 106 | Croydon (CR) | 225,833 | 22.2% | 5.4% | 10.5 years | Sidelight not working (6,401) |
| 107 | Dartford (DA) | 244,502 | 22.2% | 5.3% | 10.1 years | Sidelight not working (5,474) |
| 108 | Enfield (EN) | 195,435 | 21.7% | 5.4% | 10.4 years | Sidelight not working (4,760) |
| 109 | Kingston upon Thames (KT) | 277,514 | 21.5% | 5.2% | 10.6 years | Wipers not clearing the screen (5,744) |
| 110 | Harrow (HA) | 200,040 | 21.5% | 5.9% | 10.6 years | Sidelight not working (5,025) |
| 111 | Twickenham (TW) | 243,725 | 21.5% | 5.6% | 10.5 years | Tyre tread below 1.6mm (6,179) |
| 112 | Slough (SL) | 238,855 | 21.5% | 5.1% | 11 years | Sidelight not working (5,683) |
| 113 | North West London (NW) | 222,605 | 21.3% | 5.5% | 9.6 years | Wipers not clearing the screen (5,419) |
| 114 | Sutton (SM) | 74,601 | 21.0% | 5.9% | 11.3 years | Sidelight not working (1,714) |
| 115 | Bromley (BR) | 120,173 | 21.0% | 5.1% | 9.6 years | Wipers not clearing the screen (3,202) |
| 116 | Southall (UB) | 204,599 | 20.7% | 5.5% | 10.7 years | Tyre tread below 1.6mm (5,627) |
| 117 | Romford (RM) | 270,164 | 20.6% | 4.9% | 10.2 years | Sidelight not working (5,956) |
| 118 | Ilford (IG) | 145,798 | 20.0% | 4.9% | 9.9 years | Sidelight not working (3,173) |
| - | Great Britain | 33,210,951 | 27.7% | 7.3% | 10.7 years | - |
Reading the table
- The area is where the test centre is, not where the car is kept. Most people test near home, but not all.
- It shows where cars fail more, not why. The age and mix of cars, the roads and the weather, and how test centres work can all play a part. Older cars fail more often, so the average age is shown alongside.
- Which areas are ranked: every postcode area with car MOTs, each with more than 5,000. Central London (EC) and Central London (WC) recorded no car MOTs. 2,165 tests with no postcode area recorded count only in the Great Britain total.
- Why the national figure differs from our UK MOT statistics page: this page counts calendar year 2025 and cars and light vans (class 4) from DVSA's test-by-test data; that page uses DVSA's summary tables for April to March, classes 3 and 4.
Check one vehicle
See any car or motorcycle's full MOT history by registration, with every advisory and failure explained and what the repairs usually cost. Free, no account needed.
Free MOT history checkAbout these figures
- Source: DVSA: anonymised MOT tests and results, every MOT test in Great Britain in 2025. Contains public sector information licensed under the Open Government Licence v3.0.
- "Failed first time" counts first tests that failed, plus those that failed but were fixed at the test centre within an hour and passed, as DVSA counts it. Retests, appeals and abandoned tests are left out.
- "Dangerous defect" means the test recorded at least one defect DVSA classes as dangerous. The fine for driving with one is from GOV.UK: Getting an MOT.
Using these figures
You're welcome to quote anything on this page. Please credit and link to it: RoadVerdict, "MOT fail rates by area 2025", roadverdict.co.uk/mot-statistics/by-area, from DVSA data. Journalists who want the figures for one area, or as a spreadsheet, can email hello@roadverdict.co.uk.
Common questions
Which area has the highest MOT failure rate?
Fife (KY postcodes): 36.2% of cars failed their MOT first time in 2025, against 27.7% across Great Britain. Its most common failure was "broken coil spring".
Which area has the lowest MOT failure rate?
Ilford (IG postcodes), where 20.0% of cars failed first time. 9 of the 10 lowest are London postcode areas.
What is the most common reason cars fail their MOT?
It varies by area. "Broken coil spring" is the single most common failure in 38 of the 118 areas; the table shows the top one for each.
Figures from DVSA's anonymised MOT test data for 2025. See also UK MOT statistics for fail rates by vehicle type, the top failure categories and the trend since 2013.